How to Make an Editable SVG Bar Chart
Turn a small set of values into a clear bar chart and export the result as editable SVG.
In this guide 6 sections
The SVG Chart Maker creates vertical and horizontal bar charts with editable labels, values, and colors. Use it for a small comparison in a report, presentation, or page. The current tool makes bar charts; it does not offer pie or line chart modes.
1. Prepare labels, values, and a clear title
Choose categories that can be compared on the same scale. Put the unit and context in your title or accompanying explanation, such as “Tasks completed this week” rather than “Performance.” Do not mix percentages, money, and counts in one set of bars.
For a practice chart, try three categories: Research 24, Design 36, and Build 48. These are example counts, not a dataset or claim about a real team. Keep labels short enough to fit comfortably at the final size.
2. Set the canvas and orientation
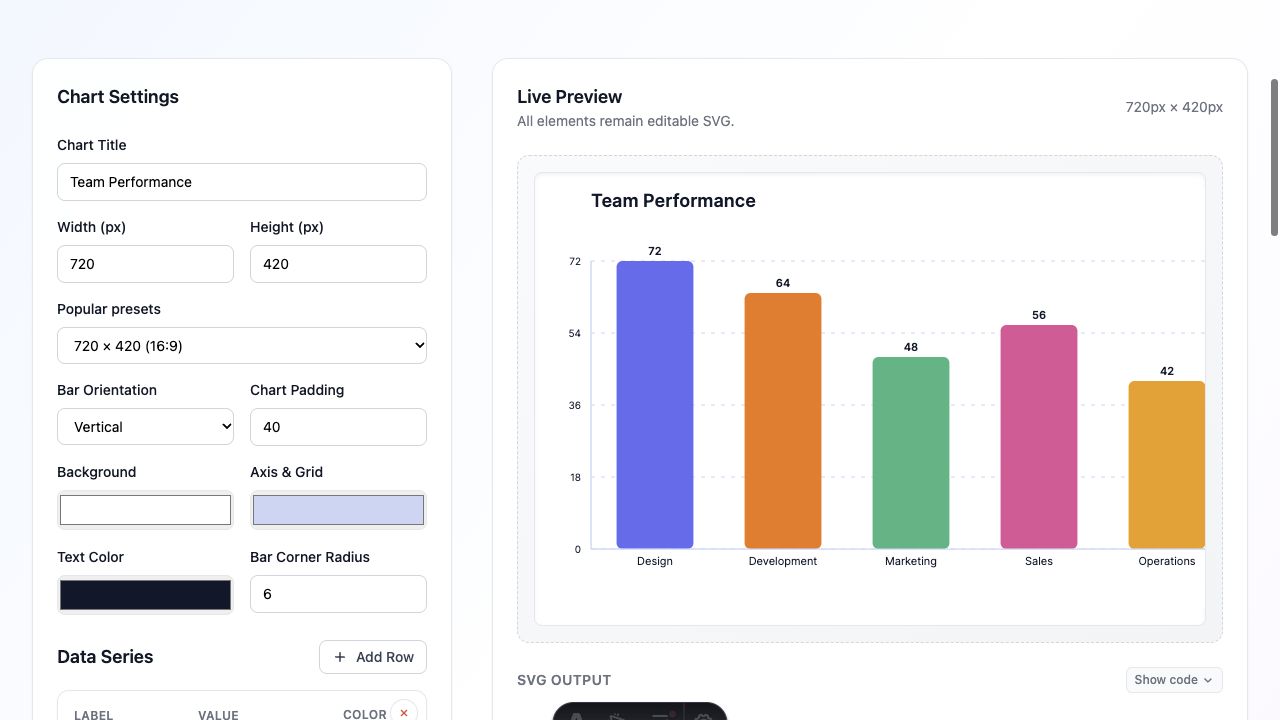
Enter Chart Title, then choose a size preset or set Width and Height. The supplied 720 × 420 preset is a convenient starting canvas; enter dimensions that suit the space where the chart will appear.
Choose Vertical for a compact set of short labels. Try Horizontal when category names need more room. Adjust Chart Padding so labels and values have space around the plot, and check that no text is clipped.
3. Replace the sample data
In Data Series, edit each row’s label, numeric value, and color. Use Add Row for another category and the row’s remove button to delete sample categories you do not need. The current value controls accept nonnegative numbers up to 500.
Check the preview after entering values. Similar-looking labels are easy to confuse, and a missing zero can change the comparison substantially. Keep a separate source table if the chart communicates real measurements.
This tool does not import a spreadsheet or maintain a live data connection. Once exported, the chart is an SVG drawing. Return to the generator or edit its elements if the values change later.
4. Style for readability
Set Background, Axis & Grid, and Text Color before fine-tuning individual bar colors. Use strong enough text contrast for the actual slide or page background. Keep the grid quiet enough that it supports the bars without competing with them.
Bar Corner Radius changes the bar styling. Use a modest radius so short bars remain easy to compare. If color marks categories, keep the labels visible as well; readers should not have to identify a color to know what a bar means.
5. Download and place the chart
Choose Download SVG or Copy SVG Code. Show code lets you inspect the output before copying. SVG preserves vector bars and text, making it useful when the chart needs to be resized or restyled later.
For a branded composition, import the chart into the editor with a title, explanatory note, or logo. Ungroup only when you need to edit individual parts, then export the finished composition.
Check the chart at its final size
Make sure every category, value, and unit is readable where the chart will appear. Compare the downloaded SVG with your source values. If a destination does not accept SVG, use the PNG export workflow and keep the SVG master for future changes.
Make it yours.
Keep this guide open and give it a try.